
Let me filter that for you
TL;DR Let’s create a Swift script that will take a list of stocks and a finance API key and give us a shortlist of dividend stocks we should consider investing in. Our script focuses on Freetrade & uses a Yahoo Finance alternative API, but it can be easily adapted to work with any list of stock tickers and any finance API. Get the code here.
Every Friday at Just Eat Takeaway we have a meeting called WWDC-watchers. It’s organised and hosted by the iOS team and open to everyone. We spend half an hour discussing a WWDC (or related) video we picked and watched during the week leading to the meeting. We keep it simple - everyone sticks a bunch of sticky notes on a dedicated virtual board, and at the meeting, we go over them one by one, sharing what we learned and how we feel about the topic.
At a recent event, we discussed a Tech Talk on a somewhat obscure Apple framework called TabularData. Watching the video and discussing it with my fellow developers excited me about the framework, and I decided to use it for an idea I had at the time.
For the past few years, I have been using Freetrade for investing. This is not an endorsement, nor is it financial advice. I primarily focus on the so-called dividend investing with the occasional impulsive buy. I choose companies to invest in by searching online or asking friends for recommendations and then doing my due diligence. Before spending too much time on research, I also need to ensure a given company is available on Freetrade.
I don’t start my research on Freetrade and instead need to go out of my way to find suitable companies because of the app’s lack of filters or tools to get to the companies that match my criteria. You are presented with a massive list of thousands of companies without filtering or sorting. Going to their website gives you some filters, but that is far from enough. Moreover, you can only see 20 companies at a time. It looks pretty, but it’s not very useful. Thankfully, if you scroll past the list, you will find a link to a google sheet with all the companies available on the platform.
You can, of course, use your superpowers in filtering google sheets to achieve what you want. But where is the fun in that? Instead, I downloaded the list in CSV and gave TabularData a spin. To learn more about TabularData I recommend you read this amazing introduction.
Before we dive into Xcode let’s have a look at the data. We have around 6300 companies with 14 properties for each of them. Let’s see which of these properties are useful for us:
Title- the company display name, the way it will appear in the app, e.g.Just Eat Takeaway.comLong_Title- the full company name, e.g.Just Eat Takeaway.com NVSubtitle- what the company does, e.g.Online food orderingCurrency- the currency, e.g.gbpISA_eligible- if you can buy the company for your ISA account, e.g.TRUESIPP_eligible- if you can buy the company for your SIPP account, e.g. TRUEISIN- no idea, e.g.NL0012015705MIC- no idea, e.g.XLONSymbol- the stock ticker, e.g.JETFractional_Enabled- whether you can buy fractional shares of the company, e.g.FALSEPLUS_only- whether you need a PLUS Freetrade account to buy the company, e.g.FALSEfor_Ireland_investors- no idea, e.g.FALSEfor_Netherlands_investors- no idea, e.g.FALSEKIID_URL- a link to a “Key Investor Information” document
As you can see, there is no information about any market performance metrics - dividend payments, dividend growth, market cap, current price, etc. The only properties we can use for our purposes are Title, Currency (if we want to focus on a given market, e.g. the US), ISA_eligible (as my account is an ISA), Symbol, and PLUS_only, as I am wondering whether to subscribe to their PLUS plan.
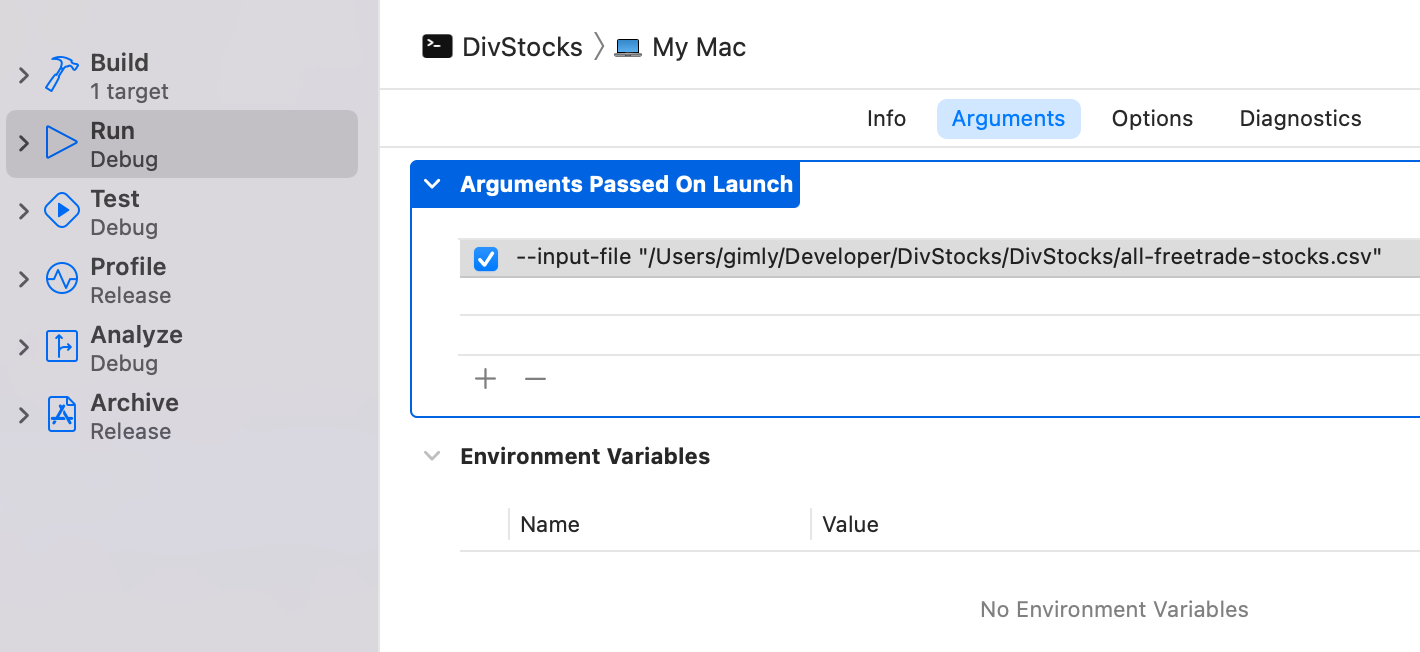
Start with creating a command line Xcode project. Add the ArgumentParser package by going to File -> Add Packages and selecting it from the Apple Swift Packages collection. Next, since we want to have the CSV file as an input to our script, let’s add it to the scheme arguments like so:
Next, let’s start by parsing our file and printing out what we read:
import TabularData
import Foundation
import ArgumentParser

@main
struct DivStocks: AsyncParsableCommand {
    @Option(name: .long, help: "The input filename with full path")
    private var inputFile: String

    func run() async throws {
        let fileUrl = URL(fileURLWithPath: inputFile)
        let pathUrl = fileUrl.deletingLastPathComponent()
        let options = CSVReadingOptions(hasHeaderRow: true,
                                        delimiter: ",")
        let fullDataFrame = try! DataFrame(
            contentsOfCSVFile: fileUrl,
            columns: ["Symbol",
                "Title",
                "Currency",
                "ISA_eligible",
                "PLUS_only"],
            types: [
                "Symbol": .string,
                "Title": .string,
                "ISA_eligible": .boolean,
                "Currency": .string,
                "PLUS_only": .boolean],
            options: options)
        print(fullDataFrame)
    }
}
Please note that I will not go into much detail on the TabularData framework itself, as this is very well covered in both the video and the article I linked above.
Running the script in Xcode should give us something like this in the console:
┏━━━━┳━━━━━━━━━━┳━━━━━━━━━━━━━━━━━━━━━┳━━━━━━━━━━┳━━━━━━━━━━━━━━┳━━━━━━━━━━━┓
┃    ┃ Symbol   ┃ Title               ┃ Currency ┃ ISA_eligible ┃ PLUS_only ┃
┃    ┃ <String> ┃ <String>            ┃ <String> ┃ <Bool>       ┃ <Bool>    ┃
┡━━━━╇━━━━━━━━━━╇━━━━━━━━━━━━━━━━━━━━━╇━━━━━━━━━━╇━━━━━━━━━━━━━━╇━━━━━━━━━━━┩
│ 0  │ ABNa     │ ABN AMRO Bank       │ eur      │ false        │ true      │
│ 1  │ ECMPAa   │ Eurocommercial      │ eur      │ false        │ true      │
│ 2  │ AVTXa    │ Avantium            │ eur      │ true         │ true      │
│ 3  │ VASTNa   │ Vastned Retail      │ eur      │ true         │ true      │
│ 4  │ VVYa     │ Vivoryon Thera      │ eur      │ true         │ true      │
│ 5  │ FURa     │ Fugro               │ eur      │ true         │ true      │
│ 6  │ VLKa     │ Van Lanschot Kempen │ eur      │ true         │ true      │
│ 7  │ FASTa    │ Fastned             │ eur      │ true         │ true      │
│ 8  │ BRNLa    │ Brunel              │ eur      │ true         │ true      │
│ 9  │ CMCOMa   │ CM.com              │ eur      │ true         │ true      │
│ 10 │ EBUSa    │ Ebusco              │ eur      │ true         │ true      │
│ 11 │ BBEDa    │ Beter Bed           │ eur      │ true         │ true      │
│ 12 │ ACOMOa   │ Amsterdam Commod    │ eur      │ true         │ true      │
│ 13 │ KENDRa   │ Kendrion            │ eur      │ true         │ true      │
│ 14 │ PNLa     │ PostNL              │ eur      │ true         │ true      │
│ 15 │ ALFENa   │ Alfen Beheer        │ eur      │ true         │ true      │
│ 16 │ AMGa     │ AMG Advanced Metal  │ eur      │ true         │ true      │
│ 17 │ AALBa    │ Aalberts            │ eur      │ true         │ true      │
│ 18 │ JDEPa    │ JDE Peet's          │ eur      │ true         │ true      │
│ 19 │ VPKa     │ Koninklijke Vopak   │ eur      │ true         │ true      │
┢╍╍╍╍┷╍╍╍╍╍╍╍╍╍╍┷╍╍╍╍╍╍╍╍╍╍╍╍╍╍╍╍╍╍╍╍╍┷╍╍╍╍╍╍╍╍╍╍┷╍╍╍╍╍╍╍╍╍╍╍╍╍╍┷╍╍╍╍╍╍╍╍╍╍╍┪
┇ ...                                                                       ┇
┗╍╍╍╍╍╍╍╍╍╍╍╍╍╍╍╍╍╍╍╍╍╍╍╍╍╍╍╍╍╍╍╍╍╍╍╍╍╍╍╍╍╍╍╍╍╍╍╍╍╍╍╍╍╍╍╍╍╍╍╍╍╍╍╍╍╍╍╍╍╍╍╍╍╍╍┛
6,359 rows, 5 columns
Let’s filter out non-US companies and only include those that require a paid subscription and are ISA-eligible. This will help me decide if a PLUS plan subscription is worth my money.
        let dataFrame = fullDataFrame
            .filter(on: "Currency", String.self, { $0 == "usd" })
            .filter(on: "ISA_eligible", Bool.self, { $0! })
            .filter(on: "PLUS_only", Bool.self, { $0! })
            .selecting(columnNames: "Symbol", "Title")

        print(dataFrame)
We get a much shorter list of 445 companies. It’s still a lot to sip through one by one, but a significant improvement over the 6359 companies above.
┏━━━━━━┳━━━━━━━━━━┳━━━━━━━━━━━━━━━━━━━━━━━━━━┓
┃      ┃ Symbol   ┃ Title                    ┃
┃      ┃ <String> ┃ <String>                 ┃
┡━━━━━━╇━━━━━━━━━━╇━━━━━━━━━━━━━━━━━━━━━━━━━━┩
│ 2255 │ ANDE     │ Andersons                │
│ 2281 │ TILE     │ Interface                │
│ 2358 │ CALM     │ Cal-Maine Foods          │
│ 2592 │ DCOM     │ Dime Community           │
│ 2595 │ CPSI     │ Computer Programs        │
│ 2789 │ CONN     │ Conn's                   │
│ 2799 │ ANIK     │ Anika Therapeutics       │
│ 2915 │ AGYS     │ Agilysys                 │
│ 2924 │ CMTL     │ Comtech Telecomm         │
│ 2962 │ COOP     │ Mr Cooper Group          │
│ 3049 │ APEI     │ American Public Ed       │
│ 3065 │ MDRX     │ Allscripts Health        │
│ 3126 │ BCOR     │ Blucora                  │
│ 3141 │ PDFS     │ PDF Solutions            │
│ 3153 │ BJRI     │ BJ's Restaurant          │
│ 3155 │ SPPI     │ Spectrum Pharmaceuticals │
│ 3159 │ VREX     │ Varex Imaging            │
│ 3164 │ THRM     │ Gentherm                 │
│ 3170 │ FARO     │ Faro                     │
│ 3181 │ ANGO     │ Angiodynamics            │
┢╍╍╍╍╍╍┷╍╍╍╍╍╍╍╍╍╍┷╍╍╍╍╍╍╍╍╍╍╍╍╍╍╍╍╍╍╍╍╍╍╍╍╍╍┪
┇ ...                                        ┇
┗╍╍╍╍╍╍╍╍╍╍╍╍╍╍╍╍╍╍╍╍╍╍╍╍╍╍╍╍╍╍╍╍╍╍╍╍╍╍╍╍╍╍╍╍┛
445 rows, 2 columns
Next, we need to figure out a way to enrich the data about these companies with details about market cap, dividends, PE ratio, and other useful information. As developers, we know the best way to do that is by using an API. I googled for a free one, and not many came up. Most don’t offer dividend data, so I ended up using this Yahoo Finance alternative API. It has a free tier offering 100 requests per day, which is a very low number, so we need to be very careful when using it, or we would need to wait until tomorrow to continue our experiments. Since we don’t plan to be running this script frequently, a one-time parsing of the data is more than enough, and we can save some money by using the free tier.
Looking at the documentation, the /v6/finance/quote endpoint is suitable for our needs. It gives us a lot of data for a given company, and we can also query 10 companies at a time, which, considering the 100 requests/day limit, means that by grouping our requests we can get data for all of the 445 companies in one day. Let’s create a model that matches the fields we need from the response:
struct Stock: Decodable {
    let symbol: String
    let trailingAnnualDividendYield: Double?
    let trailingPE: Double?
    let averageAnalystRating: String?
    let marketCap: Int?
    let epsTrailingTwelveMonths: Double?
}

struct QuoteResponse: Decodable {
    let result: [Stock]
}

struct StockResponse: Decodable {
    let quoteResponse: QuoteResponse
}
Depending on your investment strategy and where the market is at a given time, your filters might be vastly different from mine. Even mine might change from day to day. That’s why it makes sense to download and store the market data for these 445 companies and then be able to tweak our filters at will without worrying about API rate limiting.
Let’s design our API client to do just that. Our saveStocks() method will need two arguments - the list of stock symbols (remember, up to 10) and our API key.
func saveStocks(symbols: [String], apiKey: String, pathUrl: URL) async throws {
    let parameters = [
        "region": "US",
        "lang": "en",
        "symbols": symbols.joined(separator: ",")
    ]
    var components = URLComponents(string: "https://yfapi.net/v6/finance/quote")!
    components.queryItems = parameters.map { (key, value) -> URLQueryItem in
        URLQueryItem(name: key, value: String(value))
    }
    var request = URLRequest(url: components.url!)
    request.httpMethod = "GET"
    request.addValue("application/json; charset=utf-8", forHTTPHeaderField: "Content-Type")
    request.addValue(apiKey, forHTTPHeaderField: "X-API-KEY")
    let (data, response) = try await session.data(for: request)
    guard (response as? HTTPURLResponse)?.statusCode == 200 else {
        throw APIClientError.invalidResponse
    }

    let fileUrl = pathUrl.appendingPathComponent("stocks-\(symbols[0]).json")
    try data.write(to: fileUrl)
}
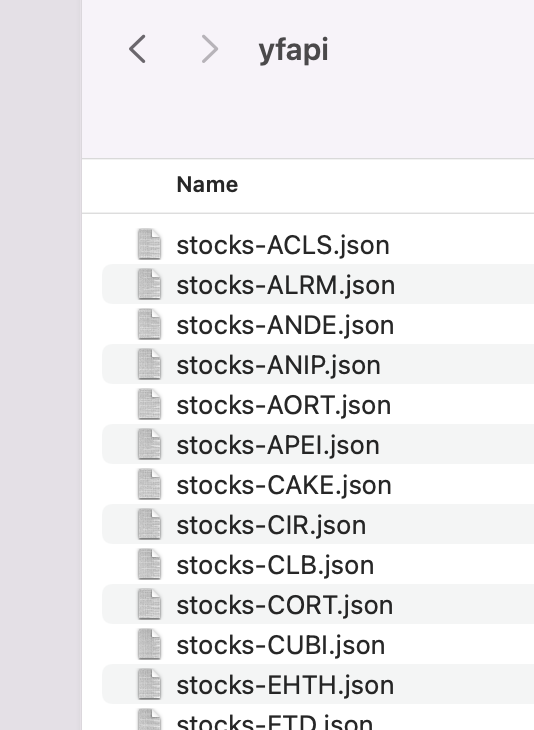
We are using the first symbol in each group as a name for the file - you can improvise here, like using numbers or hashing the list. Since all the symbols are unique, picking the first one should be good enough. Looking at the folder afterwards, we can see the resulting files.
Our next step is to add a method to read the files and return them to our script. We already have all the necessary parts for this, so the technique is relatively straightforward.
func stocks(symbols: [String], pathUrl: URL) async throws -> [Stock] {
    let fileUrl = pathUrl.appendingPathComponent("stocks-\(symbols[0]).json")
    do {
        let data = try Data(contentsOf: fileUrl)
        let decoder = JSONDecoder()
        let decoded = try decoder.decode(StockResponse.self, from: data)
        return decoded.quoteResponse.result
    } catch {
        return []
    }
}
Let’s return to our main script and use the methods we created. First, let’s update the script to accept some more arguments. We need one for the mode (i.e. whether we are saving data to disk or parsing it) and one for our API key. This is how the first few lines look now.
struct DivStocks: AsyncParsableCommand {
    @Option(name: .long, help: "The input filename with full path")
    private var inputFile: String
    @Option(name: .long, help: "Whether to save data locally or use it to do analysis. Use 'save' or 'parse' or leave out to parse")
    private var mode: String?
    @Option(name: .long, help: "You API key for yahoofinanceapi.com")
    private var apiKey: String?

    func run() async throws {
        let fileUrl = URL(fileURLWithPath: inputFile)
        let pathUrl = fileUrl.deletingLastPathComponent()
        let shouldSave: Bool = (mode == "save")
        let options = CSVReadingOptions(hasHeaderRow: true, delimiter: ",")
Next, we create a new temporary data frame containing only the symbols and use Apple’s Algorithms framework to group them in chunks of 10 quickly. We need these chunks for both getting the API data and parsing the already saved files.
let tickerData = dataFrame.selecting(columnNames: "Symbol")
let symbolGroups = tickerData.rows.compactMap { row in
    (row["Symbol"] as! String)
}.chunks(ofCount: 10)
The save mode is straightforward - we use our API client and pass the chunks of symbols.
if shouldSave {
    let apiClient = APIClient()
    guard let apiKey = apiKey else {
        print("Please provide an API key if you want to save stock data.")
        return
    }
    for symbolGroup in symbolGroups {
        try await apiClient.saveStocks(symbols: Array(symbolGroup), apiKey: apiKey, pathUrl: pathUrl)
    }
    print("Stock data saved!")
} else {
Running the script at this point should save all the downloaded data to the same folder as the input file.
$ ./stock-tables --input-file "~/stocks/all-freetrade-stocks.csv" \
    --mode save --api-key ghdssngdskFigselAsngshkmvakgjdDsggv
Now for the fun part. Let’s pick our stocks! First, we want to create a new table containing the data we gathered from the API. We will include:
- The stock symbol.
- The market cap.
- The trailing dividend yield.
- The trailing PE ratio.
- The trailing EPS.
- The average analyst rating.
Feel free to adapt this part to include or exclude what you think you need for your filters.
We create our table by creating the columns with capacity matching the number of companies we have as an input, then adding our data to the columns, and in the end, appending the columns to an empty table. It feels a bit counter-intuitive, especially if you are used to working with other data structures in Swift.
var symbolCol = Column<String>(name: "symbol", capacity: rowCount)
var marketCapCol = Column<Int>(name: "marketCap", capacity: rowCount)
var divCol = Column<Double>(name: "trailingAnnualDividendYield", capacity: rowCount)
var peCol = Column<Double>(name: "trailingPE", capacity: rowCount)
var ratingCol = Column<String>(name: "averageAnalystRating", capacity: rowCount)
var epsCol = Column<Double>(name: "epsTrailingTwelveMonths", capacity: rowCount)
var stocksDataFrame = DataFrame()

let apiClient = APIClient()
for symbolGroup in symbolGroups {
    let stocks = try await apiClient.stocks(symbols: Array(symbolGroup), pathUrl: pathUrl)
    for stock in stocks {
        symbolCol.append(stock.symbol)
        marketCapCol.append(stock.marketCap)
        divCol.append(stock.trailingAnnualDividendYield)
        peCol.append(stock.trailingPE)
        ratingCol.append(stock.averageAnalystRating)
        epsCol.append(stock.epsTrailingTwelveMonths)
    }
}

stocksDataFrame.append(column: symbolCol)
stocksDataFrame.append(column: marketCapCol)
stocksDataFrame.append(column: divCol)
stocksDataFrame.append(column: peCol)
stocksDataFrame.append(column: ratingCol)
stocksDataFrame.append(column: epsCol)
The result is a nice table with all the data we need:
┏━━━━┳━━━━━━━━━━┳━━━━━━━━━━━━━━━┳━━━━━━━━━━━━━━━━━━━━━━━━━━━━━┳━━━━━━━━━━━━┳━━━━━━━━━━━━━━━━━━━━━━┳━━━━━━━━━━━━━━━━━━━━━━━━━┓
┃    ┃ symbol   ┃ marketCap     ┃ trailingAnnualDividendYield ┃ trailingPE ┃ averageAnalystRating ┃ epsTrailingTwelveMonths ┃
┃    ┃ <String> ┃ <Int>         ┃ <Double>                    ┃ <Double>   ┃ <String>             ┃ <Double>                ┃
┡━━━━╇━━━━━━━━━━╇━━━━━━━━━━━━━━━╇━━━━━━━━━━━━━━━━━━━━━━━━━━━━━╇━━━━━━━━━━━━╇━━━━━━━━━━━━━━━━━━━━━━╇━━━━━━━━━━━━━━━━━━━━━━━━━┩
│ 0  │ ANDE     │ 1,294,674,176 │                    0.018702 │  12.473925 │ 2.0 - Buy            │                   3.068 │
│ 1  │ TILE     │   788,537,728 │                    0.002996 │  14.151548 │ 2.3 - Buy            │                   0.937 │
│ 2  │ CALM     │ 2,479,804,928 │                     0.00245 │  136.57681 │ 2.7 - Hold           │                   0.371 │
│ 3  │ DCOM     │ 1,203,996,672 │                    0.031424 │   8.220793 │ 1.6 - Buy            │                   3.732 │
│ 4  │ CPSI     │   476,646,464 │                         0.0 │  25.619047 │ 2.2 - Buy            │                    1.26 │
│ 5  │ CONN     │   347,763,008 │                         0.0 │   4.049861 │ 2.3 - Buy            │                    3.61 │
│ 6  │ ANIK     │   324,038,112 │                         0.0 │  79.571434 │ 2.3 - Buy            │                    0.28 │
│ 7  │ AGYS     │   891,197,696 │                         0.0 │        nil │ 2.3 - Buy            │                  -0.902 │
│ 8  │ CMTL     │   324,026,752 │                    0.033167 │        nil │ 2.0 - Buy            │                  -1.013 │
│ 9  │ COOP     │ 3,162,441,984 │                         0.0 │   2.293386 │ 2.2 - Buy            │                  18.658 │
│ 10 │ APEI     │   257,012,736 │                         0.0 │  14.051546 │ 1.5 - Strong Buy     │                    0.97 │
│ 11 │ MDRX     │ 2,093,000,960 │                         0.0 │  18.540598 │ 2.4 - Buy            │                   0.973 │
│ 12 │ BCOR     │   771,079,168 │                         0.0 │      102.0 │ 2.0 - Buy            │                    0.16 │
│ 13 │ PDFS     │   900,812,096 │                         0.0 │        nil │ 2.0 - Buy            │                   -0.58 │
│ 14 │ BJRI     │   601,913,536 │                         0.0 │  658.46155 │ 2.6 - Hold           │                   0.039 │
│ 15 │ SPPI     │   138,726,976 │                         0.0 │        nil │ 2.0 - Buy            │                  -1.024 │
│ 16 │ VREX     │   866,844,032 │                         0.0 │       36.3 │ 1.3 - Strong Buy     │                     0.6 │
│ 17 │ THRM     │ 2,176,421,376 │                         0.0 │  23.544804 │ 2.0 - Buy            │                    2.79 │
│ 18 │ FARO     │   614,313,472 │                         0.0 │        nil │ 2.5 - Buy            │                  -2.547 │
│ 19 │ ANGO     │   724,800,064 │                         0.0 │        nil │ 2.0 - Buy            │                  -1.023 │
┢╍╍╍╍┷╍╍╍╍╍╍╍╍╍╍┷╍╍╍╍╍╍╍╍╍╍╍╍╍╍╍┷╍╍╍╍╍╍╍╍╍╍╍╍╍╍╍╍╍╍╍╍╍╍╍╍╍╍╍╍╍┷╍╍╍╍╍╍╍╍╍╍╍╍┷╍╍╍╍╍╍╍╍╍╍╍╍╍╍╍╍╍╍╍╍╍╍┷╍╍╍╍╍╍╍╍╍╍╍╍╍╍╍╍╍╍╍╍╍╍╍╍╍┪
┇ ...                                                                                                                       ┇
┗╍╍╍╍╍╍╍╍╍╍╍╍╍╍╍╍╍╍╍╍╍╍╍╍╍╍╍╍╍╍╍╍╍╍╍╍╍╍╍╍╍╍╍╍╍╍╍╍╍╍╍╍╍╍╍╍╍╍╍╍╍╍╍╍╍╍╍╍╍╍╍╍╍╍╍╍╍╍╍╍╍╍╍╍╍╍╍╍╍╍╍╍╍╍╍╍╍╍╍╍╍╍╍╍╍╍╍╍╍╍╍╍╍╍╍╍╍╍╍╍╍╍╍┛
442 rows, 6 columns
Our next and final step is to apply filters and trim down the list to a handful of stocks we like, which we will then spend some time looking into before buying. This step is the most subjective - the filters I will show you are almost certainly not the ones best suited for your needs. So rather than explaining and defending my strategy, I will try to generalise it so you can apply the algorithm easily to your situation.
Let’s say we only want companies with more than a billion-dollar market cap. We also want them to be profitable, so their EPS (earnings per share) need to be a positive number. And finally, let’s focus on companies with at least a 1% yearly dividend yield. Let’s see the code:
let oneData = dataFrame.joined(stocksDataFrame, on: (left: "Symbol", right: "symbol"), kind: .left)
    .filter(on: "marketCap", Int.self, { $0 ?? 0 > 1000000000 })
    .filter(on: "epsTrailingTwelveMonths", Double.self, { $0 ?? 0 > 0 })
    .filter(on: "trailingAnnualDividendYield", Double.self, { $0 ?? 0 > 0.01 })
    .selecting(columnNames: "Symbol", "left.Title", "right.marketCap", "right.trailingAnnualDividendYield", "right.averageAnalystRating")
┏━━━━━┳━━━━━━━━━━┳━━━━━━━━━━━━━━━━━━━━━━━━━┳━━━━━━━━━━━━━━━━━┳━━━━━━━━━━━━━━━━━━━━━━━━━━━━━━━━━━━┳━━━━━━━━━━━━━━━━━━━━━━━━━━━━┓
┃     ┃ Symbol   ┃ left.Title              ┃ right.marketCap ┃ right.trailingAnnualDividendYield ┃ right.averageAnalystRating ┃
┃     ┃ <String> ┃ <String>                ┃ <Int>           ┃ <Double>                          ┃ <String>                   ┃
┡━━━━━╇━━━━━━━━━━╇━━━━━━━━━━━━━━━━━━━━━━━━━╇━━━━━━━━━━━━━━━━━╇━━━━━━━━━━━━━━━━━━━━━━━━━━━━━━━━━━━╇━━━━━━━━━━━━━━━━━━━━━━━━━━━━┩
│ 0   │ ANDE     │ Andersons               │   1,294,674,176 │                          0.018702 │ 2.0 - Buy                  │
│ 3   │ DCOM     │ Dime Community          │   1,203,996,672 │                          0.031424 │ 1.6 - Buy                  │
│ 28  │ TTEC     │ TTEC                    │   3,060,135,936 │                          0.014306 │ 1.9 - Buy                  │
│ 30  │ JJSF     │ J&J Snack Foods         │   2,501,749,248 │                          0.019463 │ 2.2 - Buy                  │
│ 32  │ BANF     │ BancFirst Corp          │   2,684,981,248 │                          0.017108 │ 3.2 - Hold                 │
│ 37  │ PATK     │ Patrick Inds            │   1,560,645,504 │                          0.018709 │ 2.2 - Buy                  │
│ 47  │ SBSI     │ Southside Bank          │   1,231,553,664 │                          0.034331 │ 3.0 - Hold                 │
│ 54  │ IPAR     │ Inter Parfums           │   2,324,677,632 │                          0.013877 │ 2.5 - Buy                  │
│ 59  │ UCBI     │ United Comm. Bank       │   3,161,725,184 │                          0.026792 │ 2.1 - Buy                  │
│ 64  │ FHB      │ First Hawaiian          │   3,147,763,968 │                          0.042328 │ 3.3 - Hold                 │
│ 66  │ SAFT     │ Safety Ins              │   1,230,186,496 │                          0.042669 │ nil                        │
│ 69  │ MRTN     │ Marten Transport        │   1,473,398,016 │                          0.010033 │ 2.2 - Buy                  │
│ 72  │ KLIC     │ Kulicke and Soffa       │   3,059,982,592 │                          0.011819 │ 2.6 - Hold                 │
│ 73  │ EGBN     │ EagleBank               │   1,568,721,792 │                          0.031389 │ 3.0 - Hold                 │
│ 81  │ COLB     │ Columbia Banking System │   2,238,077,184 │                          0.040788 │ 2.7 - Hold                 │
│ 95  │ BANR     │ Banner Corp             │   1,880,339,840 │                          0.030693 │ 2.5 - Buy                  │
│ 98  │ PPBI     │ Pacific Premier Bank    │   2,995,054,080 │                          0.042485 │ 2.6 - Hold                 │
│ 118 │ SHOO     │ Steve Madden            │   3,058,015,488 │                          0.017405 │ 2.1 - Buy                  │
│ 124 │ SCHL     │ Scholastic Cp           │   1,257,351,552 │                          0.016616 │ nil                        │
│ 125 │ FFBC     │ First Financial Bank    │   1,907,738,496 │                          0.045365 │ 3.0 - Hold                 │
┢╍╍╍╍╍┷╍╍╍╍╍╍╍╍╍╍┷╍╍╍╍╍╍╍╍╍╍╍╍╍╍╍╍╍╍╍╍╍╍╍╍╍┷╍╍╍╍╍╍╍╍╍╍╍╍╍╍╍╍╍┷╍╍╍╍╍╍╍╍╍╍╍╍╍╍╍╍╍╍╍╍╍╍╍╍╍╍╍╍╍╍╍╍╍╍╍┷╍╍╍╍╍╍╍╍╍╍╍╍╍╍╍╍╍╍╍╍╍╍╍╍╍╍╍╍┪
┇ ...                                                                                                                         ┇
┗╍╍╍╍╍╍╍╍╍╍╍╍╍╍╍╍╍╍╍╍╍╍╍╍╍╍╍╍╍╍╍╍╍╍╍╍╍╍╍╍╍╍╍╍╍╍╍╍╍╍╍╍╍╍╍╍╍╍╍╍╍╍╍╍╍╍╍╍╍╍╍╍╍╍╍╍╍╍╍╍╍╍╍╍╍╍╍╍╍╍╍╍╍╍╍╍╍╍╍╍╍╍╍╍╍╍╍╍╍╍╍╍╍╍╍╍╍╍╍╍╍╍╍╍╍┛
98 rows, 5 columns
We achieved some success, but we have two remaining problems. First, we still have 98 companies to sip through. Second, the dividend yield field is hard to read. We can also make the column titles better. Let’s get the easy tasks out of the way first.
let formatter = NumberFormatter()
formatter.numberStyle = .percent
formatter.maximumFractionDigits = 2

var prettyData = DataFrame(oneData)
prettyData.transformColumn("right.trailingAnnualDividendYield") { (val: Double) -> String in
    let number = NSNumber(value: val)
    let formattedValue = formatter.string(from: number)!
    return "\(formattedValue)"
}
prettyData.renameColumn("left.Title", to: "Company")
prettyData.renameColumn("right.marketCap", to: "Market Cap")
prettyData.renameColumn("right.trailingAnnualDividendYield", to: "Dividend Yield")
prettyData.renameColumn("right.averageAnalystRating", to: "Average Analyst Rating")
┏━━━━┳━━━━━━━━━━┳━━━━━━━━━━━━━━━━━━━━━━━━━┳━━━━━━━━━━━━━━━┳━━━━━━━━━━━━━━━━┳━━━━━━━━━━━━━━━━━━━━━━━━┓
┃    ┃ Symbol   ┃ Company                 ┃ Market Cap    ┃ Dividend Yield ┃ Average Analyst Rating ┃
┃    ┃ <String> ┃ <String>                ┃ <Int>         ┃ <String>       ┃ <String>               ┃
┡━━━━╇━━━━━━━━━━╇━━━━━━━━━━━━━━━━━━━━━━━━━╇━━━━━━━━━━━━━━━╇━━━━━━━━━━━━━━━━╇━━━━━━━━━━━━━━━━━━━━━━━━┩
│ 0  │ ANDE     │ Andersons               │ 1,294,674,176 │ 1.87%          │ 2.0 - Buy              │
│ 1  │ DCOM     │ Dime Community          │ 1,203,996,672 │ 3.14%          │ 1.6 - Buy              │
│ 2  │ TTEC     │ TTEC                    │ 3,060,135,936 │ 1.43%          │ 1.9 - Buy              │
│ 3  │ JJSF     │ J&J Snack Foods         │ 2,501,749,248 │ 1.95%          │ 2.2 - Buy              │
│ 4  │ BANF     │ BancFirst Corp          │ 2,684,981,248 │ 1.71%          │ 3.2 - Hold             │
│ 5  │ PATK     │ Patrick Inds            │ 1,560,645,504 │ 1.87%          │ 2.2 - Buy              │
│ 6  │ SBSI     │ Southside Bank          │ 1,231,553,664 │ 3.43%          │ 3.0 - Hold             │
│ 7  │ IPAR     │ Inter Parfums           │ 2,324,677,632 │ 1.39%          │ 2.5 - Buy              │
│ 8  │ UCBI     │ United Comm. Bank       │ 3,161,725,184 │ 2.68%          │ 2.1 - Buy              │
│ 9  │ FHB      │ First Hawaiian          │ 3,147,763,968 │ 4.23%          │ 3.3 - Hold             │
│ 10 │ SAFT     │ Safety Ins              │ 1,230,186,496 │ 4.27%          │ nil                    │
│ 11 │ MRTN     │ Marten Transport        │ 1,473,398,016 │ 1%             │ 2.2 - Buy              │
│ 12 │ KLIC     │ Kulicke and Soffa       │ 3,059,982,592 │ 1.18%          │ 2.6 - Hold             │
│ 13 │ EGBN     │ EagleBank               │ 1,568,721,792 │ 3.14%          │ 3.0 - Hold             │
│ 14 │ COLB     │ Columbia Banking System │ 2,238,077,184 │ 4.08%          │ 2.7 - Hold             │
│ 15 │ BANR     │ Banner Corp             │ 1,880,339,840 │ 3.07%          │ 2.5 - Buy              │
│ 16 │ PPBI     │ Pacific Premier Bank    │ 2,995,054,080 │ 4.25%          │ 2.6 - Hold             │
│ 17 │ SHOO     │ Steve Madden            │ 3,058,015,488 │ 1.74%          │ 2.1 - Buy              │
│ 18 │ SCHL     │ Scholastic Cp           │ 1,257,351,552 │ 1.66%          │ nil                    │
│ 19 │ FFBC     │ First Financial Bank    │ 1,907,738,496 │ 4.54%          │ 3.0 - Hold             │
┢╍╍╍╍┷╍╍╍╍╍╍╍╍╍╍┷╍╍╍╍╍╍╍╍╍╍╍╍╍╍╍╍╍╍╍╍╍╍╍╍╍┷╍╍╍╍╍╍╍╍╍╍╍╍╍╍╍┷╍╍╍╍╍╍╍╍╍╍╍╍╍╍╍╍┷╍╍╍╍╍╍╍╍╍╍╍╍╍╍╍╍╍╍╍╍╍╍╍╍┪
┇ ...                                                                                               ┇
┗╍╍╍╍╍╍╍╍╍╍╍╍╍╍╍╍╍╍╍╍╍╍╍╍╍╍╍╍╍╍╍╍╍╍╍╍╍╍╍╍╍╍╍╍╍╍╍╍╍╍╍╍╍╍╍╍╍╍╍╍╍╍╍╍╍╍╍╍╍╍╍╍╍╍╍╍╍╍╍╍╍╍╍╍╍╍╍╍╍╍╍╍╍╍╍╍╍╍╍┛
98 rows, 5 columns
We will try to trim down the list of stocks further by using the analyst rating we get from the API and only consider stocks with a “Strong Buy” rating (1.5 or lower). A simple string comparison will suffice for now because this script is not something we will run very often. If you want to optimise further, you can extract the numeric rating and use it for comparison.
.filter(on: "right.averageAnalystRating", String.self, { $0 ?? "2" <= "1.5" })
And voilà, we have our final list:
┏━━━┳━━━━━━━━━━┳━━━━━━━━━━━━━━━━━━━━━━━━━━━━━━┳━━━━━━━━━━━━━━━┳━━━━━━━━━━━━━━━━┳━━━━━━━━━━━━━━━━━━━━━━━━┓
┃   ┃ Symbol   ┃ Company                      ┃ Market Cap    ┃ Dividend Yield ┃ Average Analyst Rating ┃
┃   ┃ <String> ┃ <String>                     ┃ <Int>         ┃ <String>       ┃ <String>               ┃
┡━━━╇━━━━━━━━━━╇━━━━━━━━━━━━━━━━━━━━━━━━━━━━━━╇━━━━━━━━━━━━━━━╇━━━━━━━━━━━━━━━━╇━━━━━━━━━━━━━━━━━━━━━━━━┩
│ 0 │ CSGS     │ CSG Systems Intl             │ 1,893,075,840 │ 1.72%          │ 1.0 - Strong Buy       │
│ 1 │ GFF      │ Griffon                      │ 1,386,450,304 │ 1.43%          │ 1.4 - Strong Buy       │
│ 2 │ SXI      │ Standex                      │ 1,096,411,520 │ 1.07%          │ 1.2 - Strong Buy       │
│ 3 │ WD       │ Walker & Dunlop              │ 3,421,355,520 │ 2.02%          │ 1.4 - Strong Buy       │
│ 4 │ STC      │ Stewart Information Services │ 1,517,544,832 │ 2.52%          │ 1.2 - Strong Buy       │
└───┴──────────┴──────────────────────────────┴───────────────┴────────────────┴────────────────────────┘
5 rows, 5 columns
In Conclusion
We started with a big spreadsheet, and after some light coding, we have an excellent short list of companies we can further analyse. Using TabularData is easy and fun. Oh, and also, I am not subscribing to the PLUS plan - the additional companies I would be able to buy are not that appealing. Not all is lost, though. I can update the script to filter the non-PLUS companies for a follow-up article.
You can find the source code for the script on GitHub. Feel free to reach me on Twitter if you have any feedback.
And yes, we are hiring! If you want to work with me day-to-day (and who doesn’t?), ping me on Twitter!
Photo by Nathan Dumlao on Unsplash