Visual debugging with Swift Charts
When I decided to implement the algorithm Soroush Khanlou so brilliantly described in his Elevated Swift talk I didn’t expect that the hardest part would be not the algorithm for the elevator (or lift, as we call it here), but rather the one for generating the traffic.
Let’s take a step back and describe what we are trying to achieve. We have an office building with a few lifts going up and down the floors. As a typical office building we want to simulate a realistic flow of people - more during the week, less on weekends; more arriving in the morning, less so at night. We also want to keep the randomness element. And let’s not forget the lunch break with lots of people going out and back in mumbling about the queue at the lifts.
When we take all this into consideration, our next step is to decide how often we run the algorithms - both for the lifts and for the traffic flow. As we want to ideally animate the lifts at some point, we need a loop running at a set interval, ideally a short one. We also need fake in-game time or otherwise our game will only work in real time and everything will take forever. This will also help us implement controls to slow and fasten the in-game time. After some experimentation, I arrived the following:
- We have a timer that “ticks” at a set interval.
- Every “tick” equals 10 seconds in-game time.
- The initial “tick” interval is 0.5 seconds, with controls for changing it down to 0.01 (less is faster). I reached these timings with trial and error to what felt like a good pace - not too slow but also not too fast.
Some sloppy SwiftUI designing later, and we have our first running version. We can see the three lifts going up and down. There are people arriving at the ground floor. The lifts seem to be working well.
I showed it to a friend at the office and we decided to speed it up and see what happens. This would also allow me to show him a feature I’ve been building - a screen of charts for the enterpreneur who will manage the company maintaining the lifts. The more data we have, the more interesting and useful the charts will be.
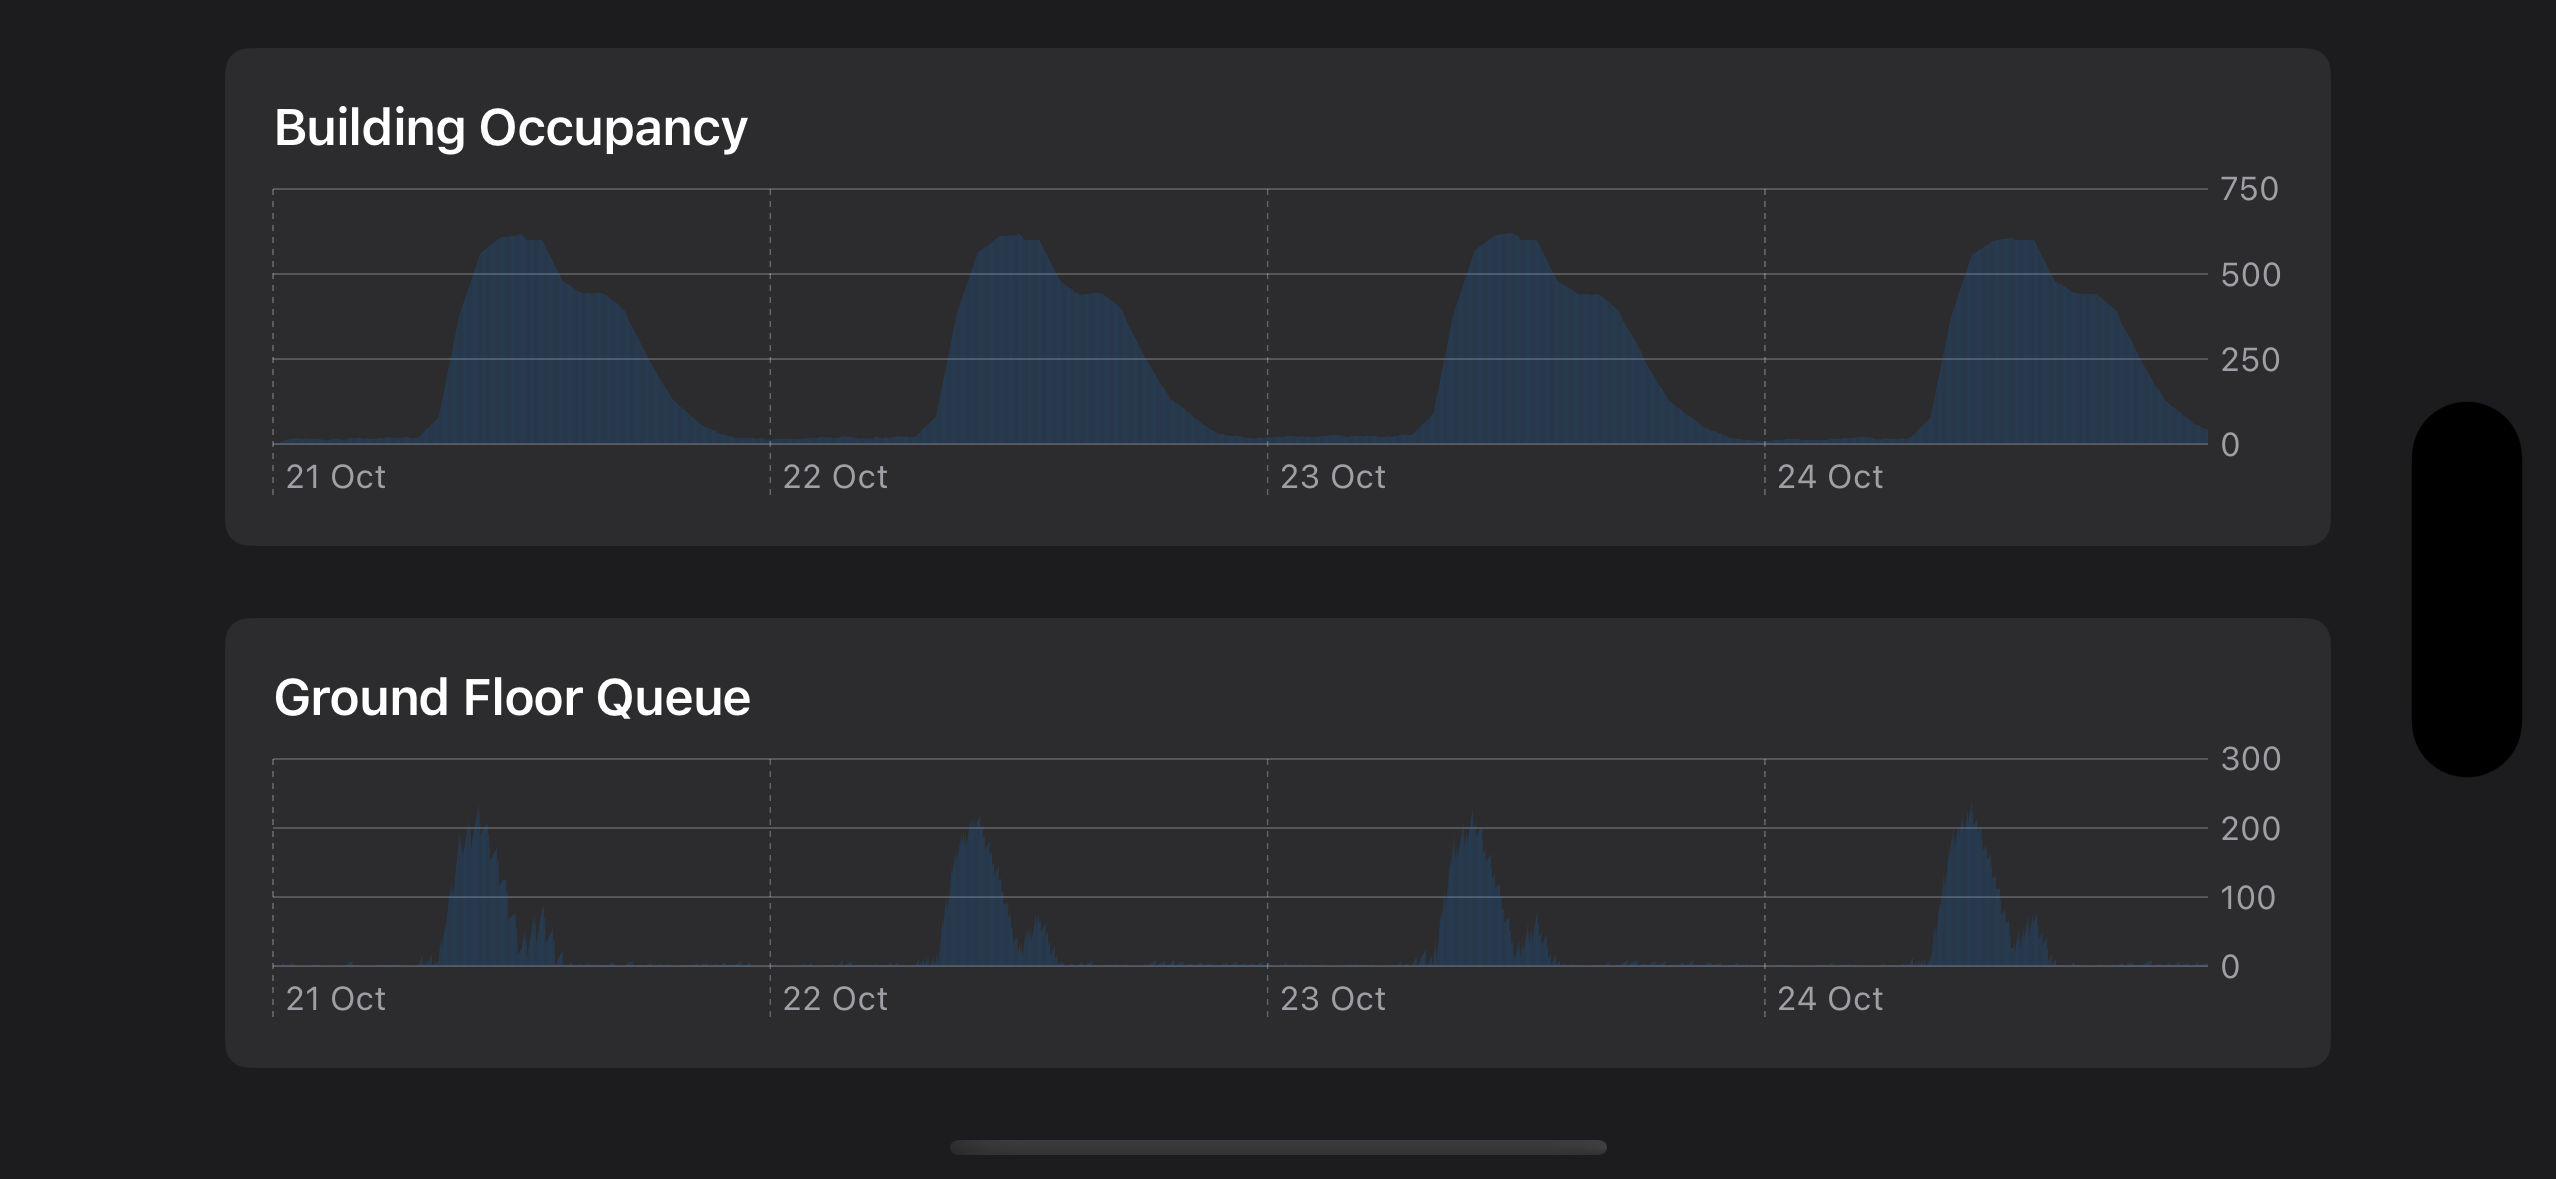
We let it run for a couple of hours and then opened the screen with the charts.
Even though the lifts seemed to be working fine, we could easily spot a problem upon seeing the charts. The shape of the chart was the same regardless of the day of the week. The people generation algorithm should have prevented this from happening.
Good thing that I decided to include charts in the game or otherwise I would have missed this. And it didn’t take much. All I needed to do is save the journey data and then display it. Moreover, Swift Charts allows you to show live charts which brings dynamisms to the game.
Every time we update the building occupancy, we save a log entry.
let newPeople = peopleArriving(hour: hour, day: day)
let peopleGoingOut = goingOut(hour: hour, day: day)
currentOccupancy += newPeople - peopleGoingOut
generateCalls(newPeople: newPeople, peopleGoingOut: peopleGoingOut)
log.append(
    LogEntry(
        date: date,
        occupancy: currentOccupancy,
        groundFloorQueue: hallCalls.filter { $0.from == 0 }.count
    )
)
The code to show the charts is pretty straightforward.
Button("Stats") {
    showingStats.toggle()
}
.sheet(isPresented: $showingStats) {
    GroupBox("Building Occupancy") {
        Chart {
            ForEach(dispatcher.building.log) { item in
                BarMark(x: .value("Minute", item.date, unit: .minute),
                        y: .value("People", item.occupancy))
            }
        }
    }
    .padding([.horizontal, .top])
    GroupBox("Ground Floor Queue") {
        Chart {
            ForEach(dispatcher.building.log) { item in
                BarMark(x: .value("Minute", item.date, unit: .minute),
                        y: .value("Ground Floor Q", item.groundFloorQueue))
            }
        }
    }
    .padding()
    .presentationDetents([.medium, .large])
}
After fixing the issue with the daily crowd generation, I realised I needed to wait until the game generates enough data to see the result. I decided to add a button to generate a day worth of data in a second. That way I could see the results immediately.
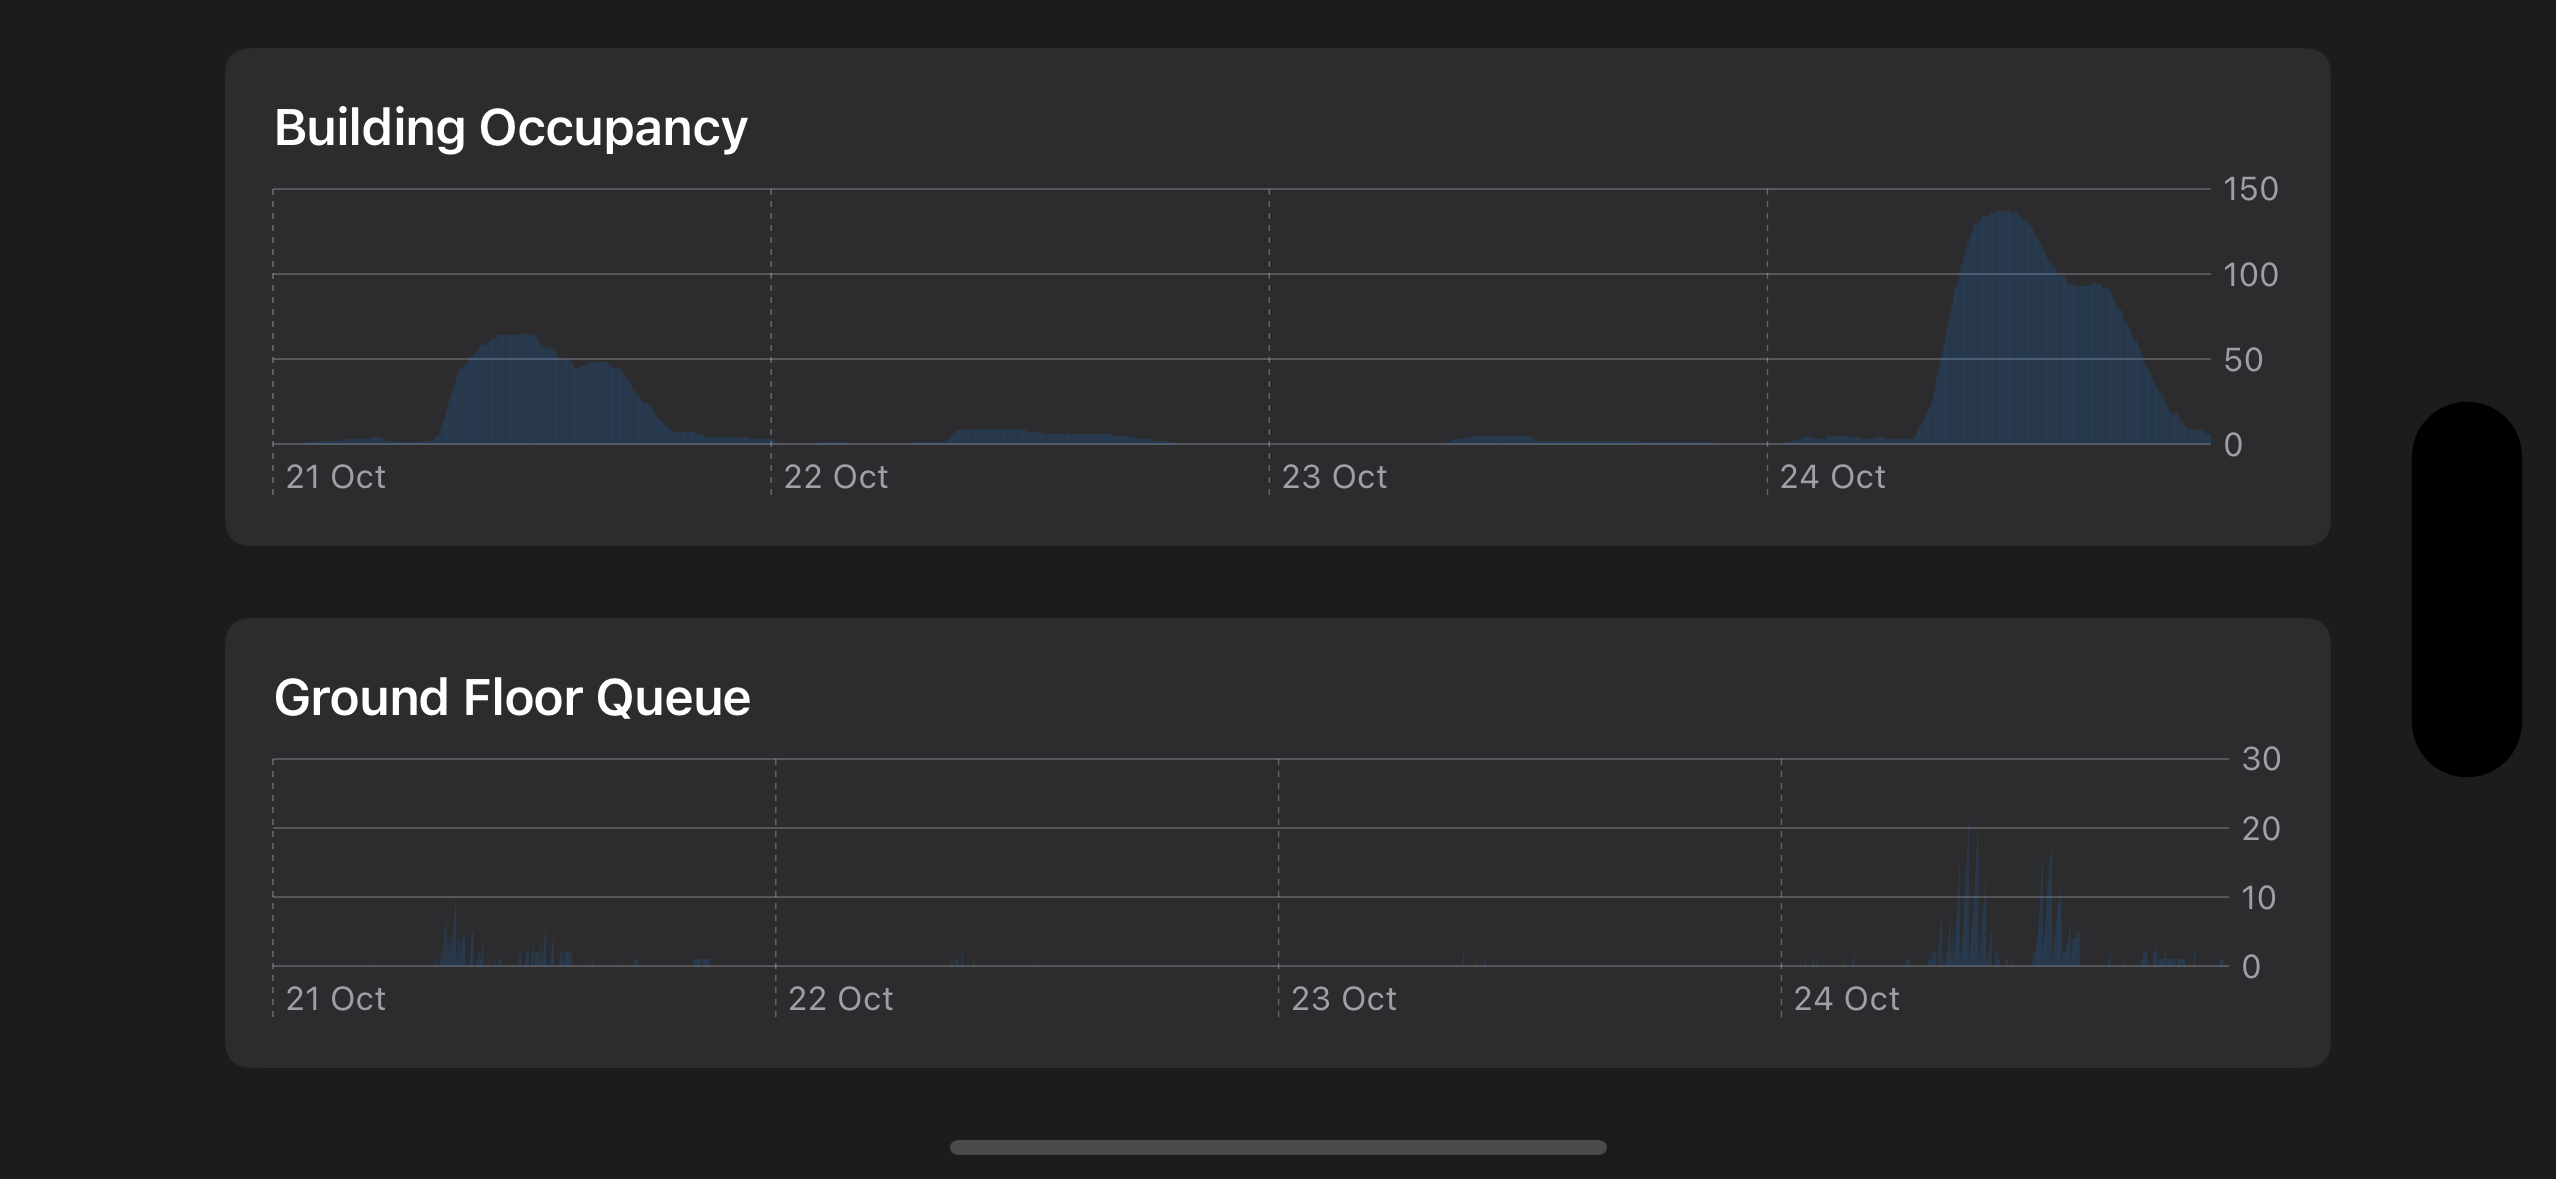
The difference was immediately visible. The weekday patterns now showed the expected morning rush, lunch dip, and evening departure patterns, while weekends remained appropriately quiet. Without the visual representation, I might have spent hours stepping through code or worse, shipped a simulation that looked fine on the surface but behaved incorrectly underneath.
This experience reinforced an important lesson: when building complex systems with time-based behaviour, visual feedback isn’t just nice to have; it’s essential. Swift Charts made it trivially easy to add this debugging capability, and the investment of a few dozen lines of code saved hours of blind debugging. The charts became not just a feature for the game’s entrepreneur character, but a development tool that continues to help me validate new features and catch regressions.
If you’re working with any kind of time-series data or algorithmic behaviour, consider adding charts early in your development process. Future you will be grateful.